New and Innovative Technologies: Infrared Imaging
Introduction
The FTIR Imaging Core has a Spectrum Spotlight FTIR imaging system. This technology utilizes PerkinElmer’s patented Dual Mode Detector (DMD). DMD provides significant performance advances compared to Infrared array detectors (64x64) previously used in this core. The Spotlight is capable of fast continuous collecting variable image size with spatial resolution of 6.25 and 25um and single-point IR microscopy. Wavelengths down to 720cm-1 can be imaged, allowing analyses of carbonate substitutions for phosphate in mineralized specimens. No probe molecule is required. The technique is non-destructive, thus results may be readily compared and contrasted against histology and histomorphometric data obtained on the very same section. Mineralized tissue sample should be embedded in PMMA (or any other similar plastic) (Step 1, Fig.1), sectioned (2um) (Step 2, Fig.1), scanned to obtain images from parts of interest (Step 3, Fig.1). All images undergo computational processing to define chemical properties of analyzed tissue (Step 4, Fig.1)
Infrared imaging can provide quantitative and qualitative information on the amount and nature of mineral and matrix present (corresponding to ash-weight and porosity measurements), mineral crystallinity (crystallite size), acid phosphate and carbonate substitute, relative amount of collagen crosslinks, orientation of collagen fibers, collagen integrity, collagen glycosylation, proteoglycans, lipids, protein secondary structure, and DNA/RNA. We have applied this technique to a variety of normal and diseased tissues including: bone, dentin, enamel, cartilage, meniscus, tendon, skin, blood vessels, and osteoblast and chondrocyte cell cultures. Materials such as polyethylene, implant devices and graft materials (osteoinduction vs osteoconduction; ossification vs calcification, comparing and contrasting tissue generated by the graft material to the host tissue), and tissue-engineered constructs have also been evaluated.
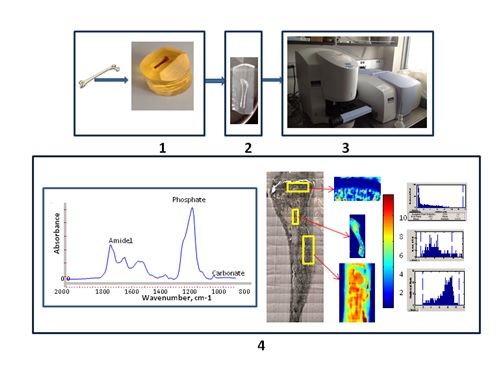
Fig.1 Steps of sample preparation: embedding (1), sectioning (2),
Scanning (3) and FTIR data processing (4)
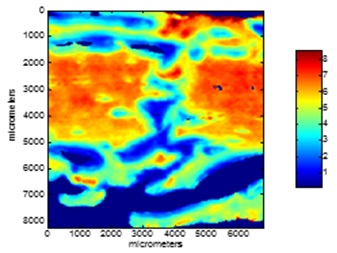
Fig.2 Mineral/Matrix distribution from the image of fracture healing site
Infrared imaging may be applied to the evaluation of human and animal tissues in a variety of diseases such as osteoporosis, osteoarthritis, osteogenesis imperfecta, osteopetrosis, atherosclerosis, and diabetes, and to the evaluation of various therapeutic protocols for these diseases. It can also be utilized in studies of protein adsorption and cellular/bacterial anchoring onto surfaces (biomineralization mechanisms, osteoinduction, pellicle and calculus formation, contact lenses), as well as dental tissues (dental caries, dentin, dentin bonding agents).
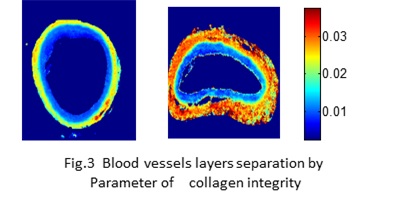
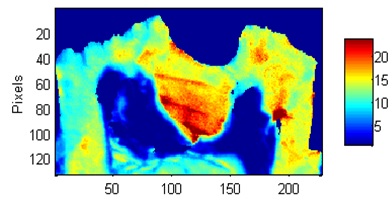
Fig.4 Mineral/Matrix Spatial distribution in the crown of a mouse tooth
Representative Publications
- Masci M, Wang M, Imbert L, Barnes AM, Spevak L, Lukashova L, Huang Y, Ma Y, Marini JC, Jacobsen CM, Warman ML, Boskey AL. Bone mineral properties in growing Col1a2(+/G610C) mice, an animal model of osteogenesis imperfecta. Bone. 2016 Jun;87:120-9. doi: 10.1016/j.bone.2016.04.011.
- Boskey AL, Donnelly E, Boskey E, Spevak L, Ma Y, Zhang W, Lappe J, Recker RR. Examining the Relationships Between Bone Tissue Composition, Compositional Heterogeneity, and Fragility Fracture: A Matched Case-Controlled FTIRI Study. J Bone Miner Res. 2016 May;31(5):1070-81. doi: 10.1002/jbmr.2759.
- Garcia I, Chiodo V, Ma Y, Boskey A. Evidence of altered matrix composition in iliac crest biopsies from patients with idiopathic juvenile osteoporosis. Connect Tissue Res. 2016;57(1):28-37. doi: 10.3109/03008207.2015.1088531.
- Gollwitzer H, Yang X, Spevak L, Lukashova L, Nocon A, Fields K, Pleshko N, Courtland HW, Bostrom MP, Boskey AL. Fourier Transform Infrared Spectroscopic Imaging of Fracture Healing in the Normal Mouse. J Spectrosc (Hindawi). 2015 Jan 1;2015. pii: 659473.
- Aido M, Kerschnitzki M, Hoerth R, Checa S, Spevak L, Boskey AL, Fratzl P, Duda GN, Wagermaier W, Willie BM. Effect of in vivo loading on bone composition varies with animal age. Exp Gerontol. 2015 Mar;63:48-58. doi: 10.1016/j.exger.2015.01.048.
- Boskey AL, Verdelis K, Spevak L, Lukashova L, Beniash E, Yang X, Cabral WA, Marini JC. Mineral and matrix changes in Brtl/+ teeth provide insights into mineralization mechanisms. Biomed Res Int. 2013;2013:295812. doi: 10.1155/2013/295812.
- Spevak L, Flach CR, Hunter T, Mendelsohn R, Boskey A. Fourier transform infrared spectroscopic imaging parameters describing acid phosphate substitution in biologic hydroxyapatite. Calcif Tissue Int. 2013 May;92(5):418-28. doi: 10.1007/s00223-013-9695-9.
- Boskey AL, Lukashova L, Spevak L, Ma Y, Khan SR. The kidney sodium-phosphate co-transporter alters bone quality in an age and gender specific manner. Bone. 2013 Apr;53(2):546-53. doi: 10.1016/j.bone.2013.01.011.
- Newton PT, Staines KA, Spevak L, Boskey AL, Teixeira CC, Macrae VE, Canfield AE, Farquharson C. Chondrogenic ATDC5 cells: an optimised model for rapid and physiological matrix mineralisation. Int J Mol Med. 2012 Nov;30(5):1187-93. doi: 10.3892/ijmm.2012.1114.
- MacDonald DE, Rapuano BE, Vyas P, Lane JM, Meyers K, Wright T. Heat and radiofrequency plasma glow discharge pretreatment of a titanium alloy promote bone formation and osseointegration. J Cell Biochem. 2013 Oct;114(10):2363-74. doi: 10.1002/jcb.24585.
- Hall KC, Hill D, Otero M, Plumb DA, Froemel D, Dragomir CL, Maretzky T, Boskey A, Crawford HC, Selleri L, Goldring MB, Blobel CP. ADAM17 controls endochondral ossification by regulating terminal differentiation of chondrocytes. Mol Cell Biol. 2013 Aug;33(16):3077-90. doi: 10.1128/MCB.00291-13.
- Khanarian NT, Boushell MK, Spalazzi JP, Pleshko N, Boskey AL, Lu HH. FTIR-I compositional mapping of the cartilage-to-bone interface as a function of tissue region and age. J Bone Miner Res. 2014 Dec;29(12):2643-52. doi: 10.1002/jbmr.2284.
- Spalazzi JP, Boskey AL, Pleshko N, Lu HH. Quantitative mapping of matrix content and distribution across the ligament-to-bone insertion. PLoS One. 2013 Sep 3;8(9):e74349. doi: 10.1371/journal.pone.0074349.
Fee Schedule
NIH Funded Users
Instrument: $50/hour
Data Analysis by Core: $50/hour
Non-NIH Funded Academic Users
Instrument: $75/hour
Data Analysis by Core: $75/hour
Computer usage for Data Analysis by Core User is free of charge.
Instrument and Data Analysis Training: $100/hour
Contact Information
Support Staff
Mila Spevak, IR Imaging Core Technician
Phone: 212.606.1431
Fax: 212.774.7877
email: spevakm@hss.edu